Note: This page has grown from an expanded addendum to an article on WGS testing from late 2019. We have moved the material here, along with its many references, to provide more of a stand-alone coverage of this important topic. Namely, the comparison of various NGS testing services and their WGS offerings. It has been mostly measured through the yDNA chromosome by yFull. This was literally a cut-and-paste from that article and will become more well-rounded over time.
No comparisons of FTDNA mtDNA full-sequencing with WGS tests has been made. In general, due to the relatively small size, all full sequencing results from both services should be identical.
Comparing WGS microarray test results is really awaiting match site updates that take into account the increased information. Extraction of microarray test results from WGS tests via WGS Extract shows a near identical (often better) result in sites that allow imports (like GEDMatch, FTDNA, MyHeritage, LivingDNA, and Geneanet). For one example reported, look at the tail end of our document on CRAM to BAM conversion: Quick and Dirty (an odd place to have the data, we agree, but it is where it is). Also see the WGS Extract manual itself in their microarray generation section for more details.
There are a number of issues that get tracked to compare NGS testing companies. Two key ones are (a) timeliness of the results delivery and (b) quality of the results. Just like with motion pictures and the digital format of their delivery, the quality can vary greatly across the labs. Ultimately the quality can be measured by the coverage of extracted SNPs. But initially by the average read depth as well. Let's look at each.
The page has been broken up with TABS. Click the TAB of a topic of interest. Or click "No Tabs" to the right to view all inline and serially (good for printing).
See James Kane's chart comparing all the BAM files submitted and processed by his data warehouse. Sort by column Callable Loci or Avg Years / SNP. There is a delay for new test on the market getting into that chart.
See the chart(s) below of various users comparisons of their recent Dante Labs and Nebula Genomics results; sometimes to FTDNA BigY-700 and others as well. This is looking at the yDNA portion only as processed and compared on yFull — tests of the same person. Key items to note are the coverage of the (track-able, usable) Y chromosome by each test, the number of SNP calls (both positive and negative), and the hopefully near zero ambiguous and no calls as part of the SNP call total. Also, as a next level refinement, the number of novels found (that have high quality) as that is where new branching in the genealogical time frame is going to generally come from. And the number of STRs extracted.
Click on an image to see it full screen.
Post of Jim Rader's comparison on 17 Jan 2020 of 4 different test results sent through yFull processing from the Dante Labs Customer Facebook group where you can find most of the latest details (we track and contribute there).
Key items to note in this particular example. The HG19 and GRCh38 are near identical with GRCh38 getting those few more calls (both positive and negative). So the push to reprocess to GRCh38 is maybe not as important as some led it to believe. Important to get the best data. But not critical compared to doing an WGS test to get the better coverage of the yDNA. Please realize that Thomas Khran of ySeq consults closely with yFull and provides expertise on making new SNP calls from the yDNA for placement in the phylogenetic tree. What is clearly shown again here is the dramatic improvement in coverage and SNP calls by a WGS test compared to the BigY product from FTDNA. And for those that look at the size of the BAM file, a big portion of the BigY BAM is NoCalls which means no information. This is like adding cereal filler to the dog food. Need to stick to the "quality" of real data; not the apparent quantity by read depth and file size.
Post on 4 Jun 2020 of Robert McMillan's comparison of 3 different test results sent through yFull processing from the FTDNA BigY * ySeq * yFull * FGC Facebook group.
From a Facebook post on 11 Sep 2020, Michael McCarthy has reported a comparison of his FTDNA BigY-700 results to his Nebula Genomics one. He is awaiting the retest of his Dante Labs sample to get that result as well. (Used by permission.) Updated on 28 Nov to cover his BigY-500, Dante Labs 26x as delivered, and Nebula Genomics 100x tests. We also add the MosDepth chart for the Y chromosome we did earlier in the week in a separate post.
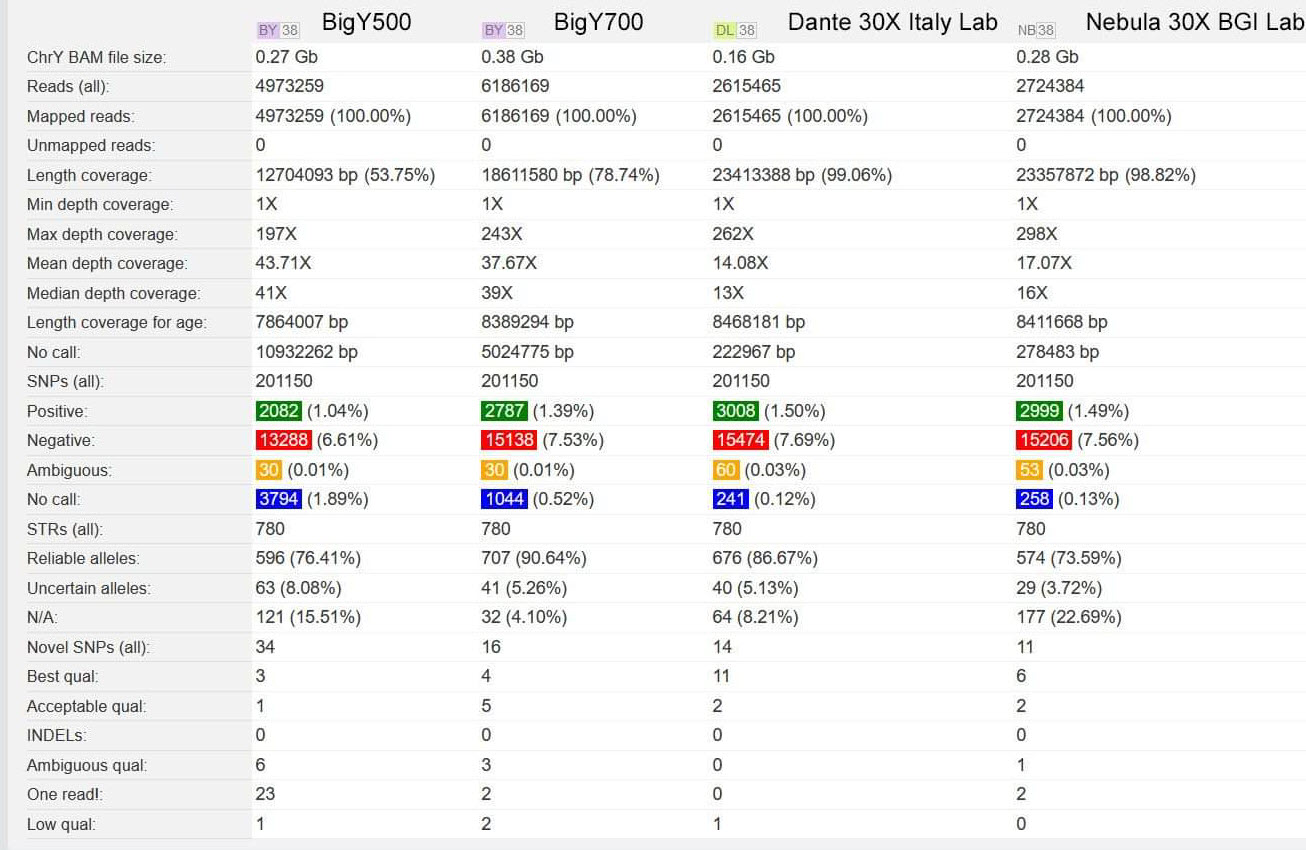
From a Facebook post on 22 Sep 2020, Douglas Holt has reported a comparison between his FTDNA BigY-500, BigY-700, Dante Labs and Nebula Genomics tests. His Dante Labs test was converted to the HG39 model by ySeq. (Used by permission)
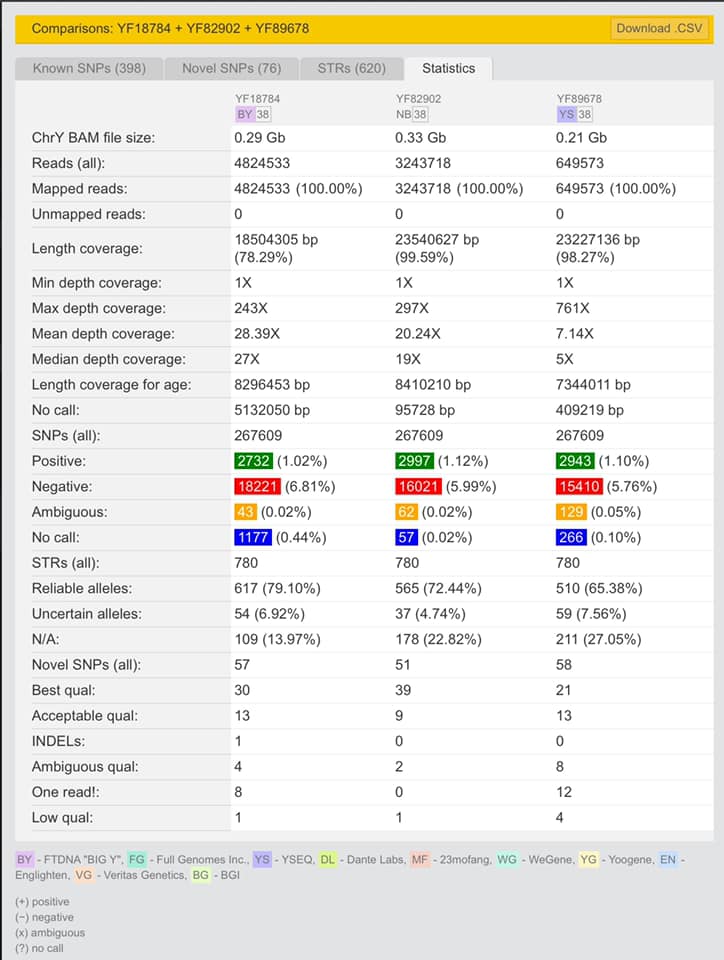
From Gint Kilmanis Facebook Post divulging his 6 Nebula Genomics kits as well as his one BigY-700 kit in his chart of the results.
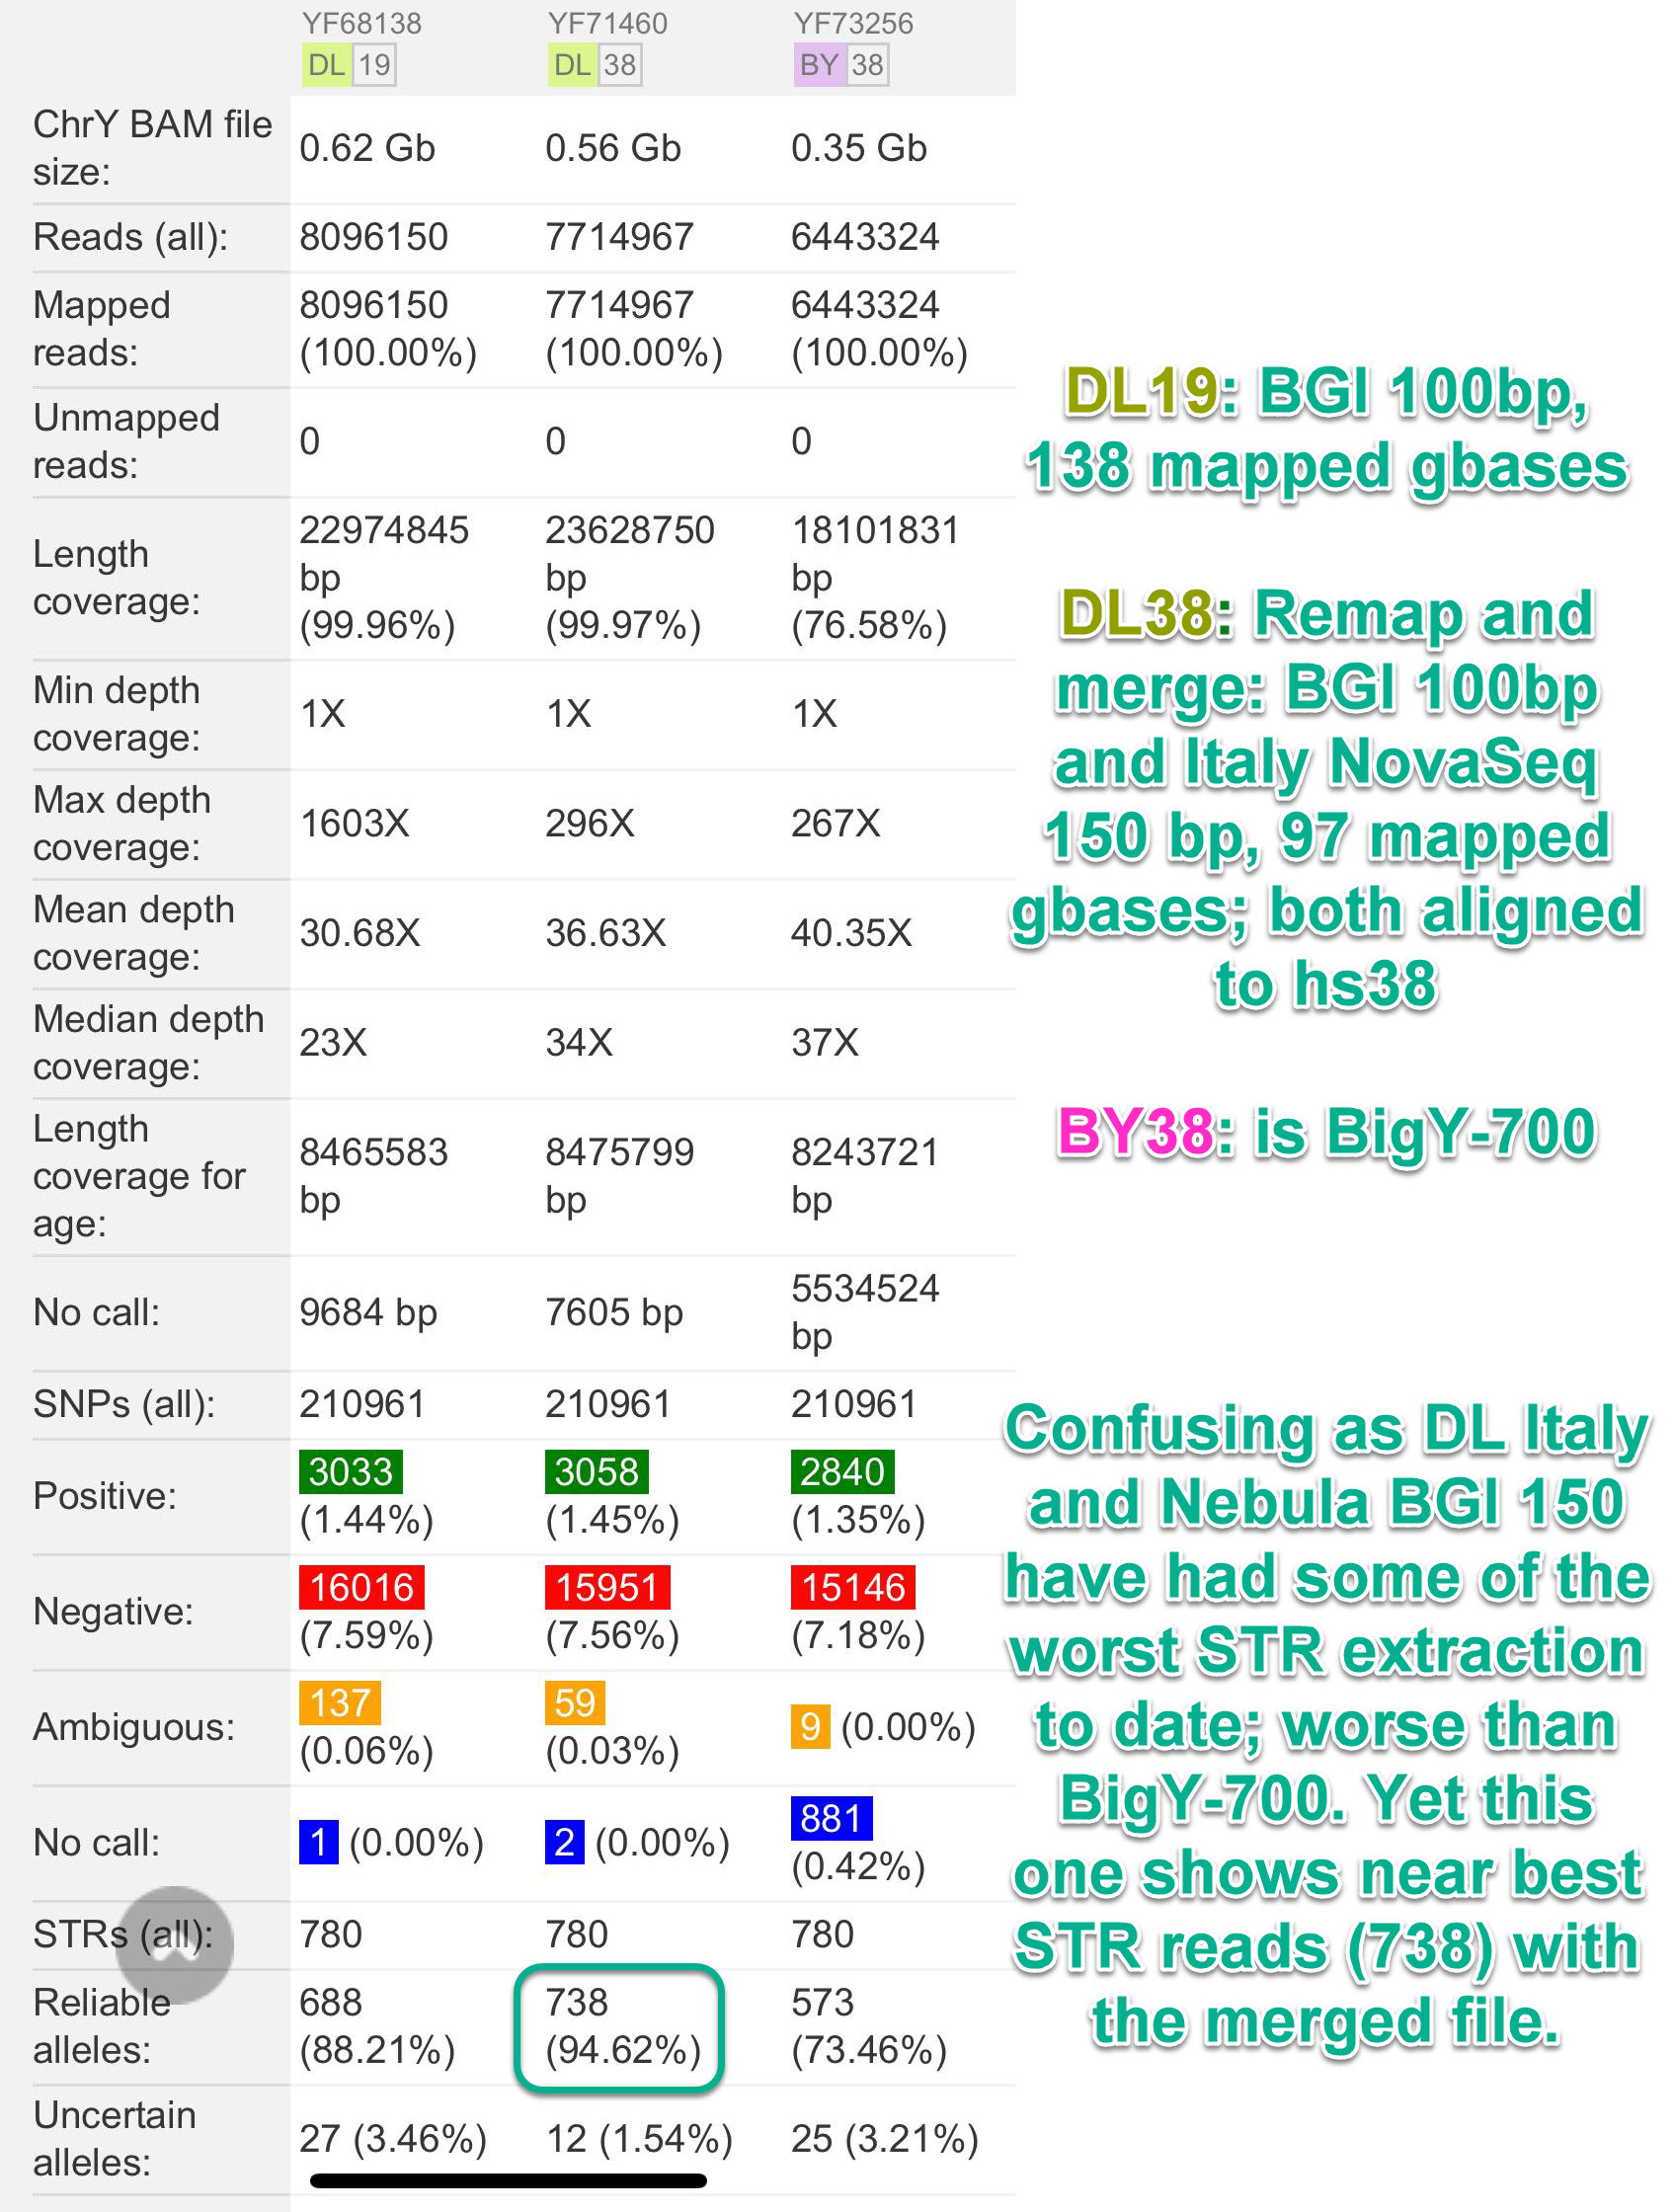
Bjarni Lichtemberg Norddahl just posted his chart of comparing 3 recent tests. A Dante Labs 30x WGS from 2018 that was performed on their BGI 100 base-pair service (before their own Italy lab) and aligned to Build19. Second, a more recent Dante 30x WGS from their Italy lab (NovaSeq 6000, 150 base-pair read segment length). He then realigned both BAMs to hs38 and merged them to create a single, large BAM. That is labeled "DL38" and the middle column. Finally, a 2020 FTDNA BigY-700 test. All the same person. Unlike the previous, we see his merged kit have the highest STR extraction to date. Original from a comment stream in a WGS Facebook group.
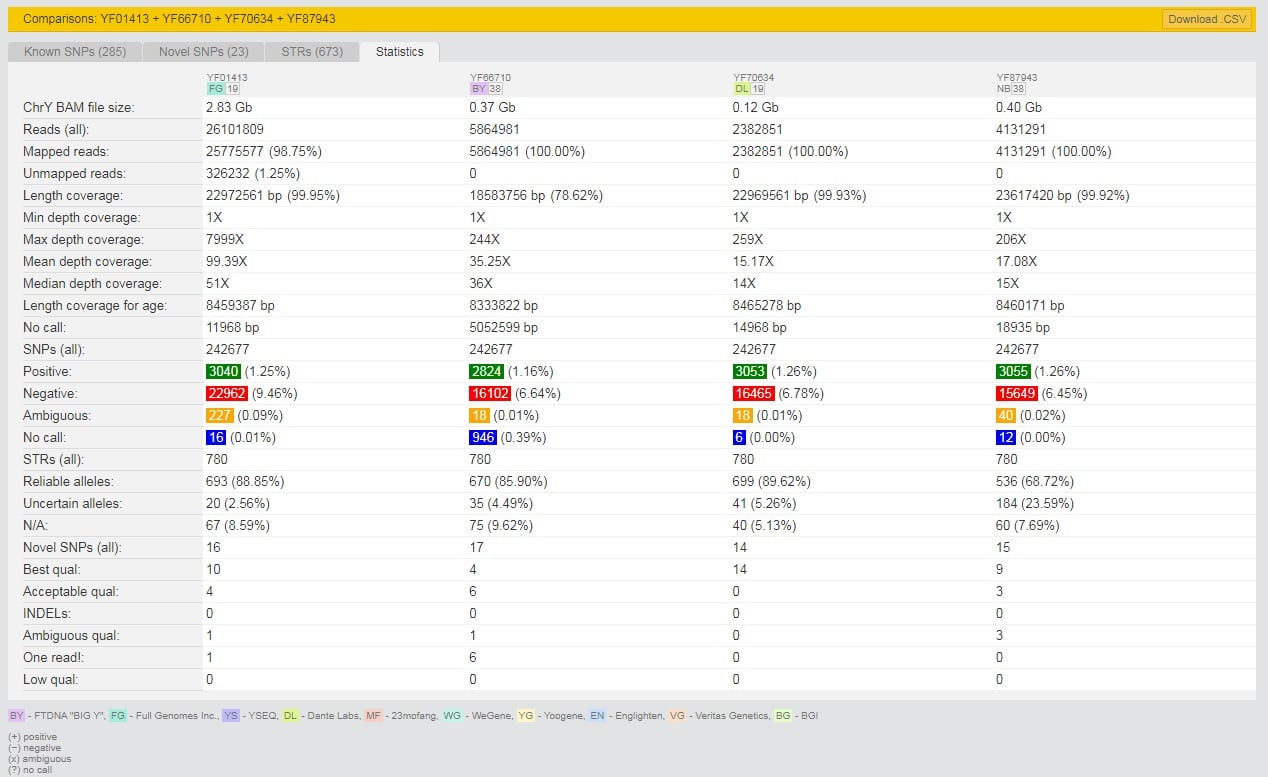
Aidan Byrne posted his chart of comparing 4 NGS tests. An FGC xxx, FTDNA BigY700, Dante Labs 30x WGS and a Nebula 30x WGS. Original from a Facebook post in yFull's Facebook group and cross-posted on the WGS Facebook group.
Posted by Joel Grant Faulisi in Facebook on 6 Sep 2021 (update 20 Nov 2021 with final STR review on ySeq) we have the first publication of a test comparison with ySeqs new WGS400 test. So even with the 30% longer sequence read length, it is not enough to overcome the lower average read depth of the WGS400 test kit. The STRs read are lower than Nebula. Note that ySeq had originally published with their product announcement a comparison using their 60x Average Read Depth public sample. That had the best STR extraction rate ever seen.
Posted by Alden Grisdale is the yFull comparison (STR only) of his Dante Labs WGS and ySeq WGS400 test result. Unlike the result posted by ySeq at inception, this one does not top the ranks on STR values extracted. In fact it comes in last for WGS tests. Suspect it is due to the 15x read depth in their current offering (and that this result reflects). The result is after manual review has completed.
Posted by David Walker on Facebook Group Y NGS Testing: FTDNA, etc on 22 Aug 2022 showing his three uploaded Y BAM files compared. From BigY-700, Nebula 100x and ySeq WGS++ (50x).
Posted by Lucy on behalf of another tester. I not only give the yFull comparison report of the ySeq realigned Dante WGS and the FTDNA BigY, but also the WGS Extract reports on them both and the original Dante and a WGSE realigned to hs38 version. Both NGS tests were done on the same sequencer by the same lab. Except for the extraordinary number of PCR duplicates (should be below 2%), the results from the WGS run by FTDNA are stellar. But why the poorer-than-BigY overall result? Still investigating.
Posted as a comment in the Facebook group but with a more detailed blog post is the entry by Andrii Lundiak. Comparing a BigY-500, BigY-700 and a Dante Labs WGS.
We simply take a post we have made several times to our Facebook group on WGS Testing and replicate the latest update here. Along with a reference list to the various posts by date.
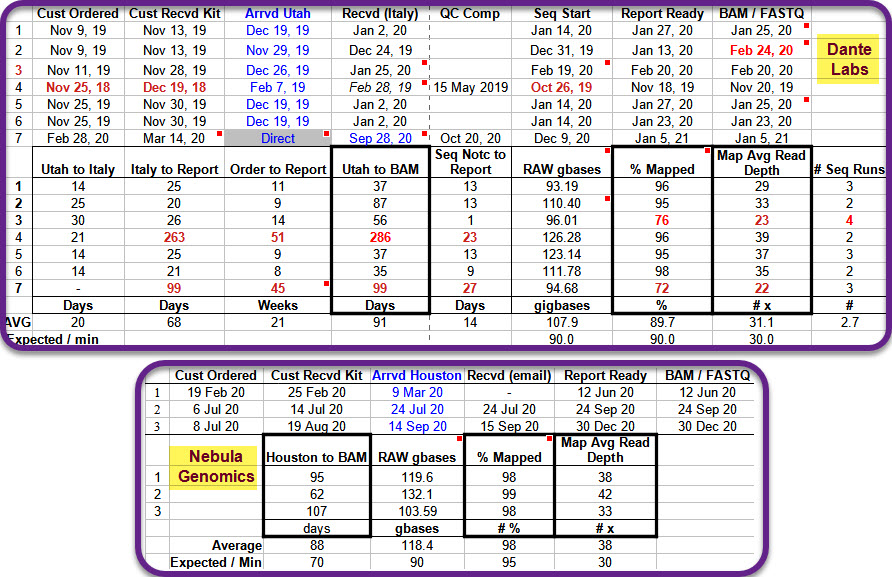
Key to note is Dante seems to have these spurts. From November thru January (2019 and 2020 at least) they deliver in weeks on newly ordered kits while some who have been waiting for six months to a year are still waiting. The [https://www.facebook.com/groups/373644229897409/|Facebook group linked below] has many reports of both quick delivery and delays over a year.
We started tracking the delivered, mapped read depth with a low mapping study and found a few kits delivered less than 20% mapped values and, even if 30x Raw (sampled), yielded thus a less than 10x mapped average read depth coverage in the end. This mapped coverage is important to be able to extract quality SNP calls. Although yDNA can get away with lower coverage as values are singular, it is still important to help assure the widest breadth of coverage across the chromosome as seen in the tables above.
Likely as a result of this wide variation by one company alone, the industry overall is spec'ing their products as a delivery of gigabases instead of (mapped) read depth coverage. Roughly 3 billion bases in the human genome reference model times 30x average read depth gets you 90 gigabases. Some offer a 45 gigabases test (15x) and even 150 gigabases( (45x) or remarkably 300 gigabases (100x). We have never seen a map rate below 90% with the other companies (and thus often a mapped average read depth coverage below 30x) but see anywhere from 20% to 98% map rate for this one company and thus delivered average read depths of 5x to 40x for an advertised 30x test.
We should note that most WGS testing reports that do a quick average read depth calculation simply use the human genome reference model length for the yDNA chromosome when reporting the yDNA read depth. As the yDNA (and xDNA in male samples) has half as many chromosomes available in the cell, the reported read depth with be half as much as the bulk of the DNA in the autosomes. So a 30x mapped read depth will likely be only 15x, at best, for the yDNA. Second, over half the yDNA chromosome is not mappable in the human genome reference model. This is not accounted for and thus yields another drop by 1/2 or more. Thus while autosomes may report a 30x mapped average read depth, yDNA will often be reported as 7-8x with these same tools. This is a misnomer and has been fixed in later releases of the WGS Extract tool.
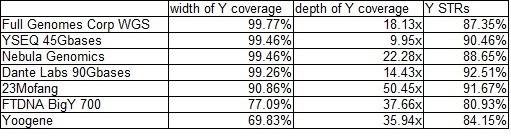
For a nice overall tutorial on calling the yDNA chromosome SNPs, see David Vance's white paper on Intro to the Y Chromosome and where SNPs are found. We now include here the table that was submitted by yFull to their own Facebook group on the occasion of the first Nebula 30x WGS test results showing up on their site (one of the authors included in that group!). The first column (width) is consistent with what we have seen from the Y-DNA Warehouse (link above). The middle column is highly dependent on the overall mapped coverage and can vary widely with some vendors. It is the last column we still need to understand better as it appears inconsistent with the earlier charts given here. They show Dante with the highest yDNA STR call coverage and BigY-700 the worst. Yet yFull own tables from user submitted kits show the near opposite with BigY-700 being the best by far and Nebula often the worse at STR calls (Dante is middle of the pack). yFull has followed up with us and says this chart is based on their 780 STRs.
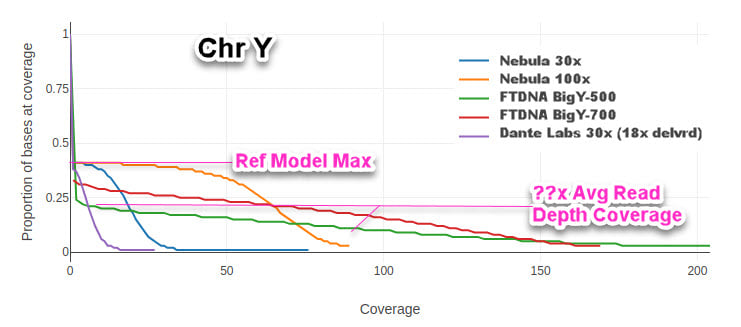
From Michael McCarthy's submission of 5 different tests, we provide this Mosdepth tool chart giving a different way of looking at the Average Read Depth stat. Usually, you see it posted as a rough bell curve centered around the average. A 30x average read depth will have a 3 sigma (standard deviation) of the whole genome covered in at least one read (read depth of 1x or greater). This chart instead shows the cumulative read depth for the whole sample. The more step-nature the chart (steep the rise), the tighter the standard deviation and thus the more of the chromosome covered by reads nearer the average read depth. The shallower the rise, the more reads that may be below a reasonable threshold of quality (4 to 8 reads depending on various factors).
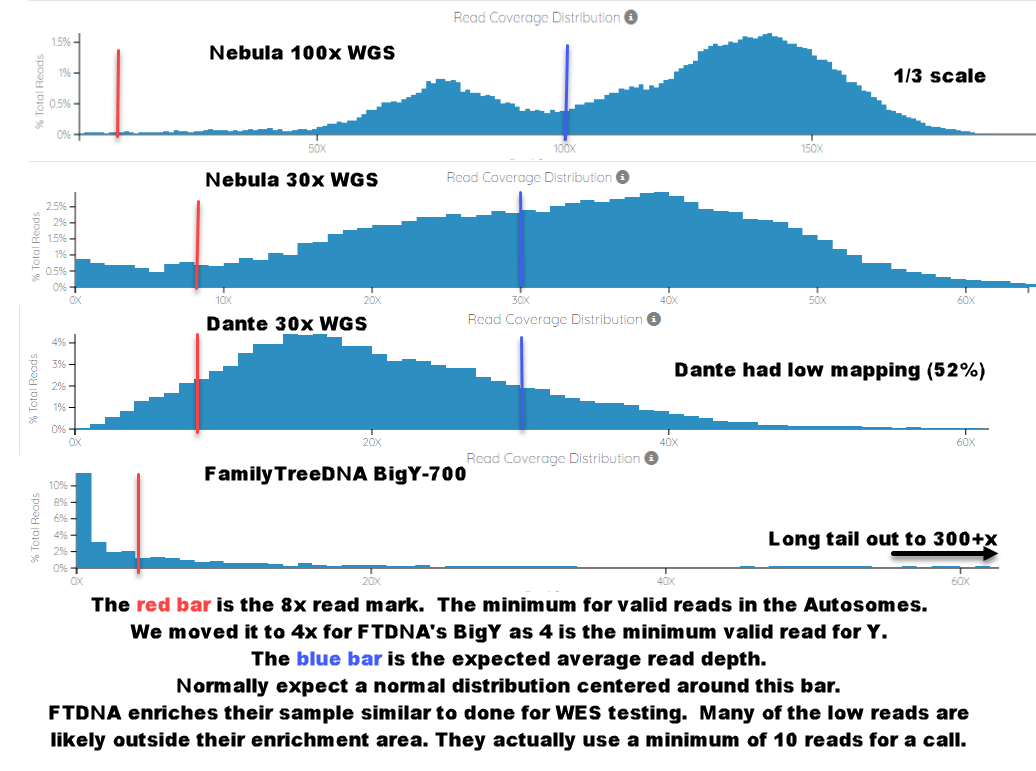
Probably more illustrative are these plots from bam.iobio.io of the read depth of various BAM files. Marked with a red line is the minimum read depth for a good call (8x for the WGS tests in the autosomes; 10x for the self-declared minimum on BigY-700). The Dante test we specifically included one of their low-map, low result returned tests to show how the RAW average read depth and the mapped / actual read depth differ significantly. The blue, bell shaped curve is the actual mapped read depth. The test returned a 30x RAW average read depth but only 18x mapped. The FTDNA BigY-700 is just a different beast all together. There are many reads of base-pairs with very, very low coverage that is not useful. But then, due to the enhancement, sometimes 300 or more reads of a particular base pair.
On this 20th anniversary of the first publication of the human genome reference model we saw the announcement by ySeq of a new product in the WGS space. Based on a 400 base-pair read length (single-end; not paired end) product developed in-house. Thus delivering on the promise of a longer read length that yields better STR extraction. ySeq now top the list with yFull that we have seen for the most STRs extracted on the yDNA chromosome. This was the last feature where BigY-700 still held a slight lead. Their new product is for 45 gbases delivered. The test sample was 195 gbases and roughly 60x. Hopefully that does not sway the overall result.
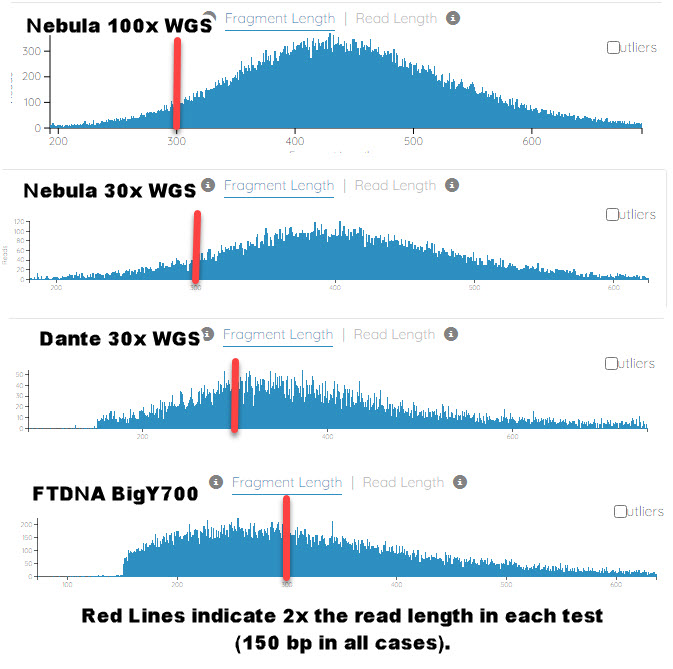
We see a trend of Nebula having the lowest STR extraction rate. We suspect this is due to a much larger fragment length being employed by BGI (the lab used by Nebula). See the chart created from plots given in bam.iobio.io of the fragment length of four different NGS test providers. All are from sequencing read lengths of 150 base-pairs. If you notice, Nebula tests are almost 2x the fragment length of BigY for the same read length. Leading to gaps of 100 base-pairs (on average, it appears, or larger). Such large gaps in highly repetitive regions could lead to alignment errors of the two read segments. And thus an inability to accurately determine the true length of the STR.
No comparisons of FTDNA mtDNA full-sequencing with WGS tests has been made. In general, due to the relatively small size, all full sequencing results from both services should be identical.
Comparing WGS microarray test results is really awaiting match site updates that take into account the increased information. Extraction of microarray test results from WGS tests via WGS Extract shows a near identical (often better) result in sites that allow imports (like GEDMatch, FTDNA, MyHeritage, LivingDNA, and Geneanet). For one example reported, look at the tail end of our document on CRAM to BAM conversion: Quick and Dirty (an odd place to have the data, we agree, but it is where it is). Also see the WGS Extract manual itself in their microarray generation section for more details.
There are a number of issues that get tracked to compare NGS testing companies. Two key ones are (a) timeliness of the results delivery and (b) quality of the results. Just like with motion pictures and the digital format of their delivery, the quality can vary greatly across the labs. Ultimately the quality can be measured by the coverage of extracted SNPs. But initially by the average read depth as well. Let's look at each.
The page has been broken up with TABS. Click the TAB of a topic of interest. Or click "No Tabs" to the right to view all inline and serially (good for printing).
Quality of Results
The bulk of the addendum is simply cut-and-pasted here. We provide the pointers to two yDNA phylogenetic tree sites that provide the analysis. Either as a public summary page or to the kit owners who upload.See James Kane's chart comparing all the BAM files submitted and processed by his data warehouse. Sort by column Callable Loci or Avg Years / SNP. There is a delay for new test on the market getting into that chart.
See the chart(s) below of various users comparisons of their recent Dante Labs and Nebula Genomics results; sometimes to FTDNA BigY-700 and others as well. This is looking at the yDNA portion only as processed and compared on yFull — tests of the same person. Key items to note are the coverage of the (track-able, usable) Y chromosome by each test, the number of SNP calls (both positive and negative), and the hopefully near zero ambiguous and no calls as part of the SNP call total. Also, as a next level refinement, the number of novels found (that have high quality) as that is where new branching in the genealogical time frame is going to generally come from. And the number of STRs extracted.
Click on an image to see it full screen.
Post of Jim Rader's comparison on 17 Jan 2020 of 4 different test results sent through yFull processing from the Dante Labs Customer Facebook group where you can find most of the latest details (we track and contribute there).
Key items to note in this particular example. The HG19 and GRCh38 are near identical with GRCh38 getting those few more calls (both positive and negative). So the push to reprocess to GRCh38 is maybe not as important as some led it to believe. Important to get the best data. But not critical compared to doing an WGS test to get the better coverage of the yDNA. Please realize that Thomas Khran of ySeq consults closely with yFull and provides expertise on making new SNP calls from the yDNA for placement in the phylogenetic tree. What is clearly shown again here is the dramatic improvement in coverage and SNP calls by a WGS test compared to the BigY product from FTDNA. And for those that look at the size of the BAM file, a big portion of the BigY BAM is NoCalls which means no information. This is like adding cereal filler to the dog food. Need to stick to the "quality" of real data; not the apparent quantity by read depth and file size.
Post on 4 Jun 2020 of Robert McMillan's comparison of 3 different test results sent through yFull processing from the FTDNA BigY * ySeq * yFull * FGC Facebook group.
From a Facebook post on 11 Sep 2020, Michael McCarthy has reported a comparison of his FTDNA BigY-700 results to his Nebula Genomics one. He is awaiting the retest of his Dante Labs sample to get that result as well. (Used by permission.) Updated on 28 Nov to cover his BigY-500, Dante Labs 26x as delivered, and Nebula Genomics 100x tests. We also add the MosDepth chart for the Y chromosome we did earlier in the week in a separate post.
From a Facebook post on 22 Sep 2020, Douglas Holt has reported a comparison between his FTDNA BigY-500, BigY-700, Dante Labs and Nebula Genomics tests. His Dante Labs test was converted to the HG39 model by ySeq. (Used by permission)
Douglas Holt's Comparison at yFull of same sample used for BigY-500, BigY-700, Dante Labs and Nebula Genomics. Dante Labs converted to HG38 by ySeq. Only yDNA compared.
From Gint Kilmanis Facebook Post divulging his 6 Nebula Genomics kits as well as his one BigY-700 kit in his chart of the results.
Bjarni Lichtemberg Norddahl just posted his chart of comparing 3 recent tests. A Dante Labs 30x WGS from 2018 that was performed on their BGI 100 base-pair service (before their own Italy lab) and aligned to Build19. Second, a more recent Dante 30x WGS from their Italy lab (NovaSeq 6000, 150 base-pair read segment length). He then realigned both BAMs to hs38 and merged them to create a single, large BAM. That is labeled "DL38" and the middle column. Finally, a 2020 FTDNA BigY-700 test. All the same person. Unlike the previous, we see his merged kit have the highest STR extraction to date. Original from a comment stream in a WGS Facebook group.
Bjarni yFull Comparison Chart
(18 Feb 2021)
(18 Feb 2021)
Aidan Byrne posted his chart of comparing 4 NGS tests. An FGC xxx, FTDNA BigY700, Dante Labs 30x WGS and a Nebula 30x WGS. Original from a Facebook post in yFull's Facebook group and cross-posted on the WGS Facebook group.
Aidan yFull Comparison Chart
(9 Aug 2021)
(9 Aug 2021)
Posted by Joel Grant Faulisi in Facebook on 6 Sep 2021 (update 20 Nov 2021 with final STR review on ySeq) we have the first publication of a test comparison with ySeqs new WGS400 test. So even with the 30% longer sequence read length, it is not enough to overcome the lower average read depth of the WGS400 test kit. The STRs read are lower than Nebula. Note that ySeq had originally published with their product announcement a comparison using their 60x Average Read Depth public sample. That had the best STR extraction rate ever seen.
Joel Grant Faulisi Comparisons
Posted by Alden Grisdale is the yFull comparison (STR only) of his Dante Labs WGS and ySeq WGS400 test result. Unlike the result posted by ySeq at inception, this one does not top the ranks on STR values extracted. In fact it comes in last for WGS tests. Suspect it is due to the 15x read depth in their current offering (and that this result reflects). The result is after manual review has completed.
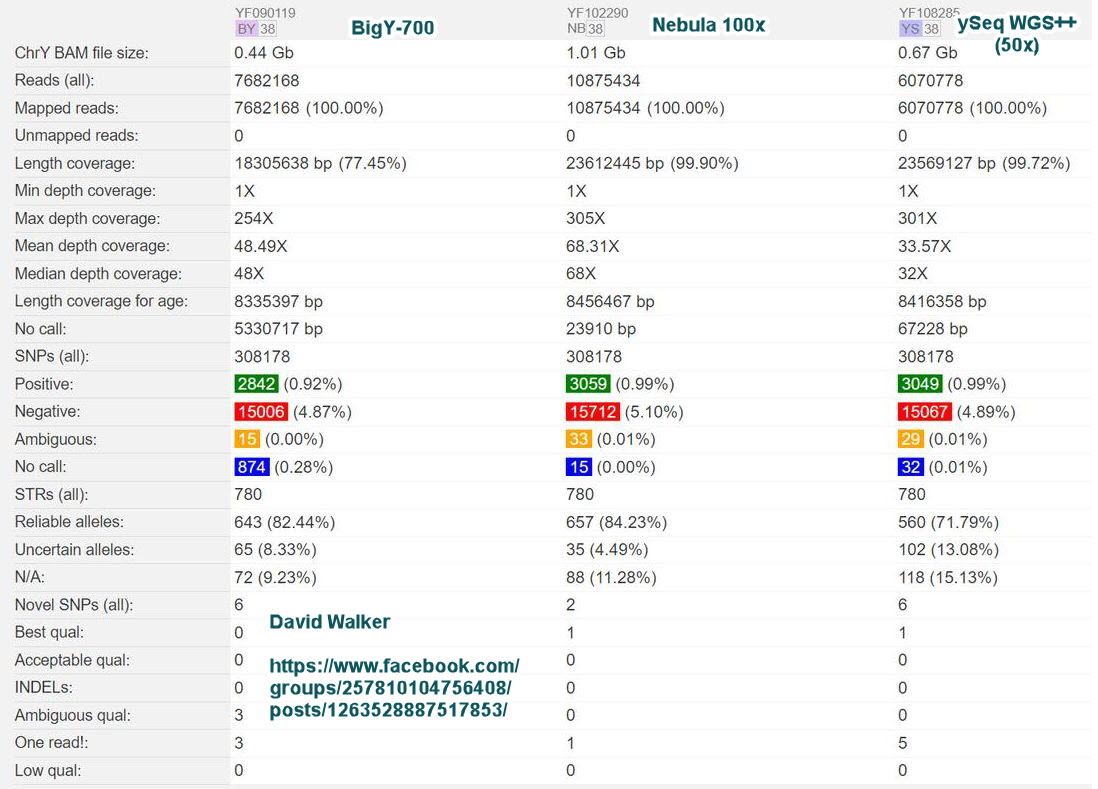
Posted by David Walker on Facebook Group Y NGS Testing: FTDNA, etc on 22 Aug 2022 showing his three uploaded Y BAM files compared. From BigY-700, Nebula 100x and ySeq WGS++ (50x).
David Walker Comparison on yFull of BigY-700, Nebula 100x, and ySeq 50x)
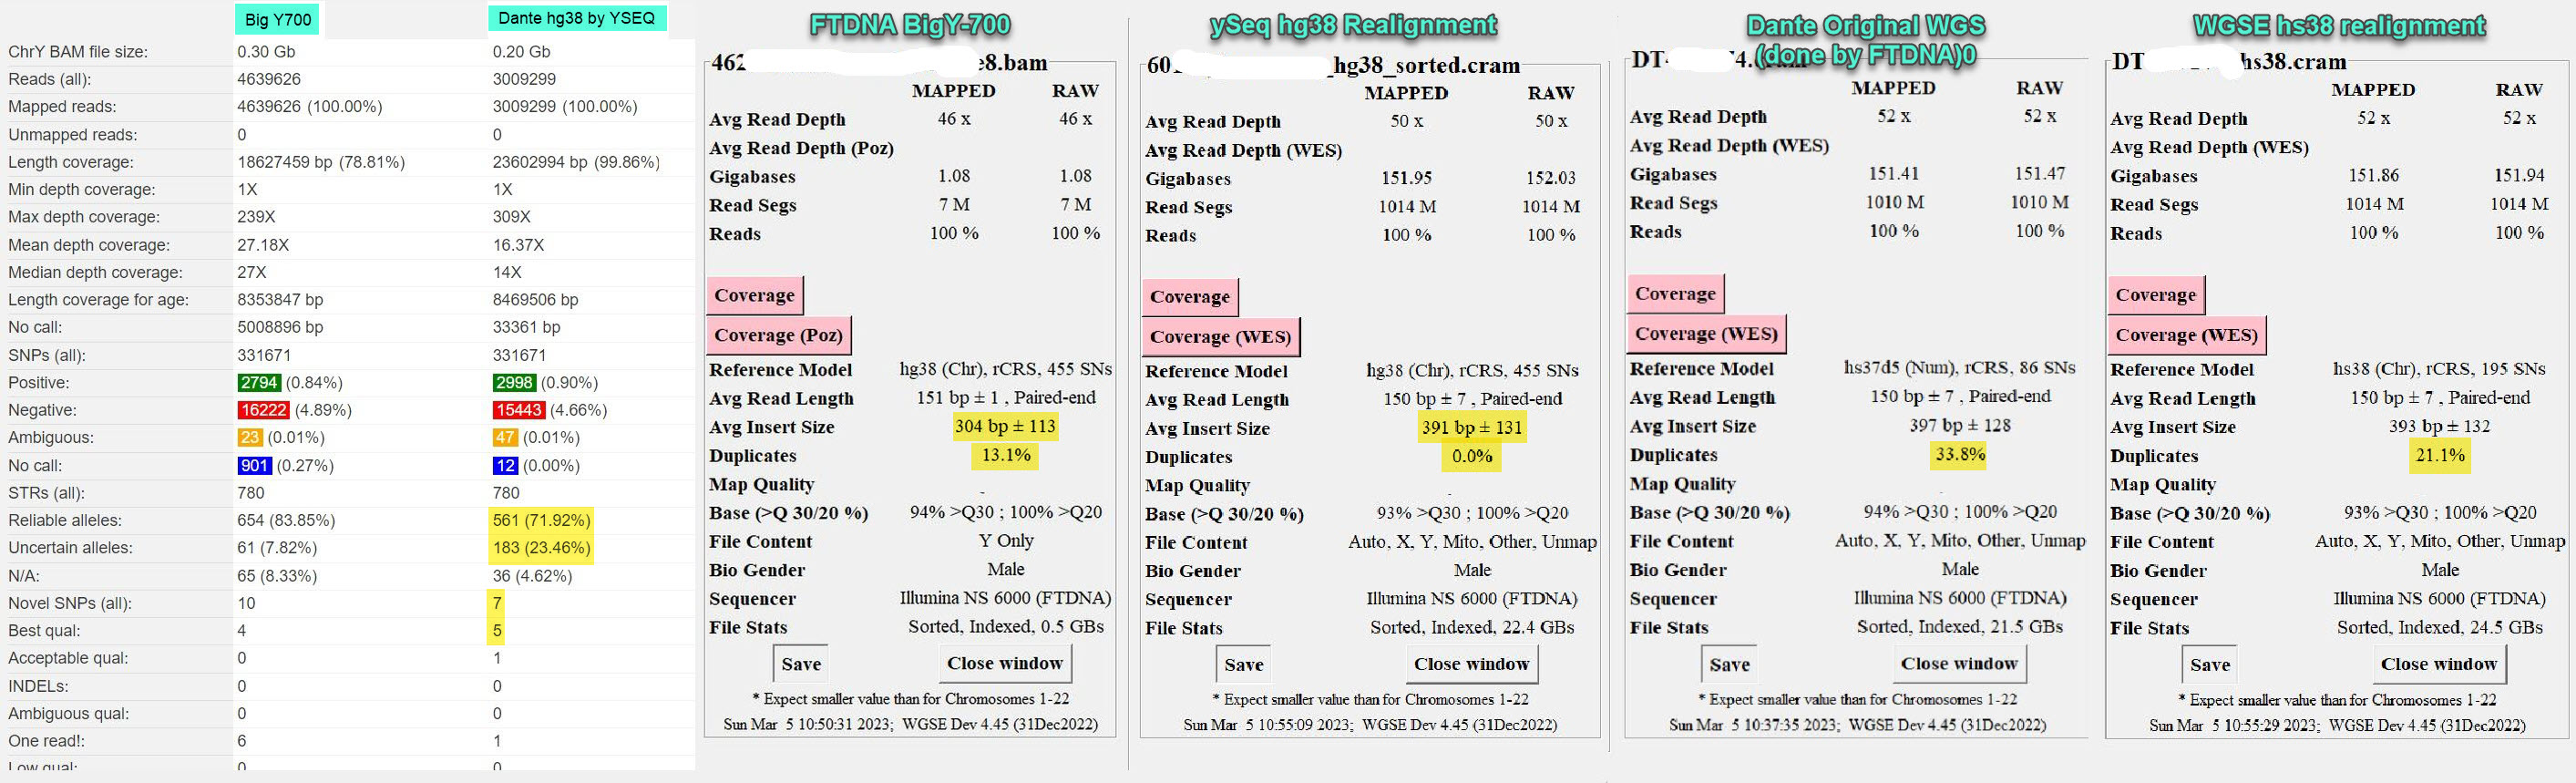
Posted by Lucy on behalf of another tester. I not only give the yFull comparison report of the ySeq realigned Dante WGS and the FTDNA BigY, but also the WGS Extract reports on them both and the original Dante and a WGSE realigned to hs38 version. Both NGS tests were done on the same sequencer by the same lab. Except for the extraordinary number of PCR duplicates (should be below 2%), the results from the WGS run by FTDNA are stellar. But why the poorer-than-BigY overall result? Still investigating.
Comparison on yFull of BigY-700 and Dante WGS; both done by FTDNA)
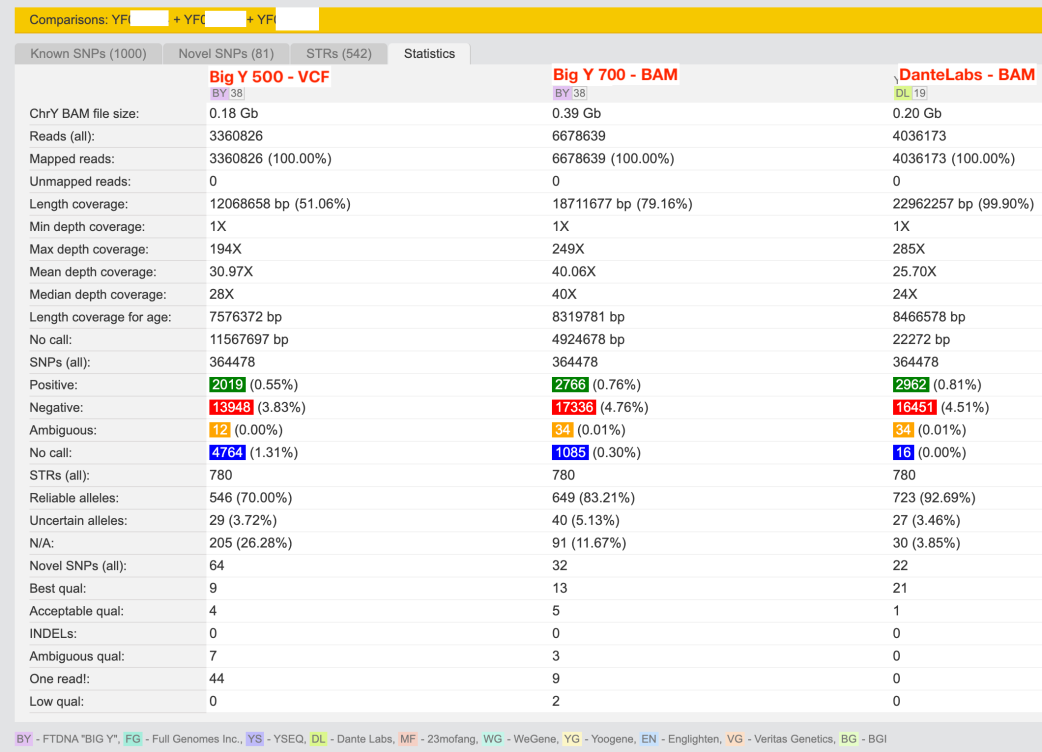
Posted as a comment in the Facebook group but with a more detailed blog post is the entry by Andrii Lundiak. Comparing a BigY-500, BigY-700 and a Dante Labs WGS.
Comparison on yFull of BigY-500, BigY-700 and Dante WGS)
References
- Li, H, Glusman G, Hu H, Shankaracharya, Caballero J, Hubley R, et al. Relationship Estimation from Whole-Genome Sequence Data, PLoS Genet 10(1): e1004144, .2014
- Koch, Jochaim, Extraction of GEDMatch kit from Dante BAM, post on 20 Oct 2019 in Dante Labs and Nebula Genomics Customer Facebook group
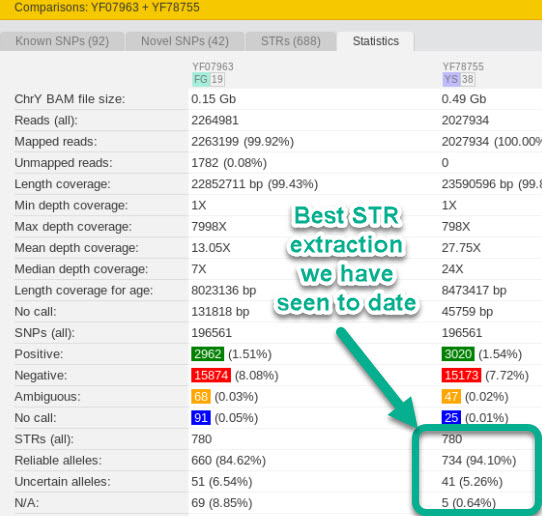
- Kollios. Antonios, https://antoniosdnaproject.de/ngs-take-part-at-the-y-tree/ (see especially figure 4 which we duplicate here, with permission, to highlight the stats on Y testing comparison as seen by yFull processing.
- Rader, Jim Facebook Post of 17 Jan 2020 in FTDNA Big Y * YSEQ * YFULL * FGC - NGS Discussion Forum on comparing 4 NGS yDNA tests in yFull (image posted above and used by permission)
- McMillen, Robert Facebook post on 4 Jun 2020 in FTDNA Big Y * YSEQ * YFULL * FGC - NGS Discussion Forum on comparing 3 NGS yDNA tests in yFull (image posted above and used by permission)
- McCarthy, Michael Facebook post on 11 Sep 2020 in Dante Labs and Nebula Genomics Customer Facebook group. Awaiting his retest of Dante Labs as well (original only had 26% mapping ...)
- Holt, Douglas Facebook post on 22 Sep 2020 in Dante Labs and Nebula Genomics Customer Facebook group.
- Kane, James, yDNA-Warehouse Statistics on various Y tests submitted to date
- Vance, David, Intro to the Y chromosome and where SNPs are found — white paper on regions of reliable coverage (archive) originally from a Dec 2019 Facebook post. See also his detailed (spreadsheet-formatted) chart of Y regions from Jan 6 2021 Facebook Post and his document Intro to Y-SNPs and Y-SNP Trees from a Facebook post Dec 2018.
- yFull Comparison Chart of Y sequencing tests (posted to their Facebook group on 17 Jun 2020)
- Byrne, Aiden Facebook post on 9 Aug 2021 comparing his four NGS tests on yFull: BigY700, FGC, Dante 30x WGS and Nebula 30x WGS.
- Faulisi, Joel Grant Facebook post on 6 Sep 2021 comparing his BigY700, Nebula and ySeq WGS400 tests with each other on yFull. (Note: WGS400 result likely not manually verified by yFull yet.)
- Grisdale, Aldon Facebook comment on 7 Sep 2021 comparing Dante and ySeq WGS400 (STR Only).
- Walker, David Facebook Post 22 Aug 2022 comparing BigY-700, Nebula 100x and ySeq WGS++ (50x) on yFull.
- Nelson, Lucy, Facebook Post 3 Feb 2023 Comparing BigY-700 to Dante 30x WGS on yFull and with WGS Extract tool — both done by FTDNA in Houston on the same sequencer.
- Lundiak Andrii, Blog Post on kit uploads comparing BigY-500, BigY-700 and Dante Labs WGS. Original post on 19 Jul 2022.
Timeliness of Delivery
WGS Timeline (6 Jan 2021)
Key to note is Dante seems to have these spurts. From November thru January (2019 and 2020 at least) they deliver in weeks on newly ordered kits while some who have been waiting for six months to a year are still waiting. The [https://www.facebook.com/groups/373644229897409/|Facebook group linked below] has many reports of both quick delivery and delays over a year.
References
- WGS Group Facebook post of 6 Jan 2020 on previous 2020 test results from both Nebula and Dante
- WGS Facebook post of 19 Dec 2019 (updated as late as Feb 2020) on 7 Dante kit results
Average Read Depth
Average Read Depth was a focus early on as we saw widely varying degrees of coverage. A deep investigation yielded how the Clinical lab standards require a 30x Mapped Average Read Depth of Coverage for WGS tests and possibly 100-130x mapped for WES Exomic region tests (where genes are) that only is 2% of the human DNA. While most are delivering this clinical standard, one company in particular has a very wide range of variance from this; mostly below.We started tracking the delivered, mapped read depth with a low mapping study and found a few kits delivered less than 20% mapped values and, even if 30x Raw (sampled), yielded thus a less than 10x mapped average read depth coverage in the end. This mapped coverage is important to be able to extract quality SNP calls. Although yDNA can get away with lower coverage as values are singular, it is still important to help assure the widest breadth of coverage across the chromosome as seen in the tables above.
Likely as a result of this wide variation by one company alone, the industry overall is spec'ing their products as a delivery of gigabases instead of (mapped) read depth coverage. Roughly 3 billion bases in the human genome reference model times 30x average read depth gets you 90 gigabases. Some offer a 45 gigabases test (15x) and even 150 gigabases( (45x) or remarkably 300 gigabases (100x). We have never seen a map rate below 90% with the other companies (and thus often a mapped average read depth coverage below 30x) but see anywhere from 20% to 98% map rate for this one company and thus delivered average read depths of 5x to 40x for an advertised 30x test.
We should note that most WGS testing reports that do a quick average read depth calculation simply use the human genome reference model length for the yDNA chromosome when reporting the yDNA read depth. As the yDNA (and xDNA in male samples) has half as many chromosomes available in the cell, the reported read depth with be half as much as the bulk of the DNA in the autosomes. So a 30x mapped read depth will likely be only 15x, at best, for the yDNA. Second, over half the yDNA chromosome is not mappable in the human genome reference model. This is not accounted for and thus yields another drop by 1/2 or more. Thus while autosomes may report a 30x mapped average read depth, yDNA will often be reported as 7-8x with these same tools. This is a misnomer and has been fixed in later releases of the WGS Extract tool.
yFull Comparison Chart
(17 Jun 2020)
(17 Jun 2020)
Mosdepth Chart of Y Coverage from same samples
BAM.iobio.io Avg Read Depth Charts
yFull Comparison Chart
(16 Feb 2021)
(16 Feb 2021)
Fragment Length Comparisons
References
- Our Average Read Depth quick primer and estimator; as well as Average Read Depth Backgrounder
- Low Mapping Study looking to see if a central cause could be extracted
- WGS Extract v3 Manual section on Average Read Depth and Breadth of Coverage