A Phylogenetic Tree in genetic genealogy is an evolutionary-order, branching-tree of the species homo-sapiens (that is, modern humans). More specifically, a mathematical partial order of haplogroups based on the suspected historical order when certain SNP "derived" values first occurred in the human population. More formally, the complete title is Phylogenetic Tree of Haplogroups. Wow, that is a mouthful.
Before explaining this further, lets first re-introduce the Taxonomic Rank from your school days to help understand this further.
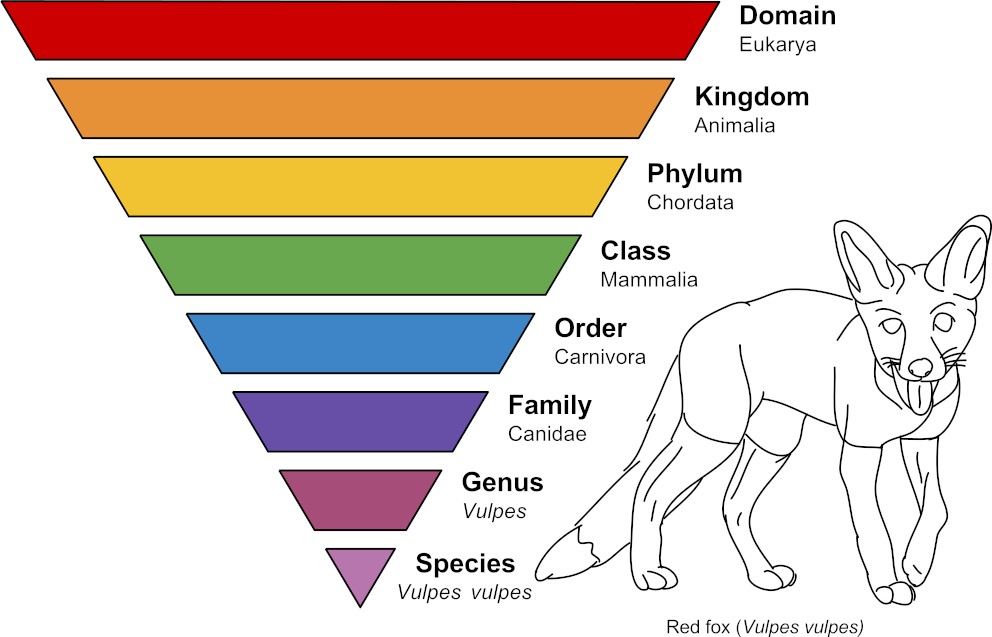
Most of us learned in school of the triangle Taxonomic Rank. Historically, we learned of 7 Taxa like Kingdom, Phylum, Class, and so on down to Species as the lowest point. Homo Sapiens (or current humans) is a Species. Species is the lowest level ranking that all living things are classified with. There are millions of species. An example is depicted here using a Red Fox and sourced from Wikimedia under a Creative Commons license.
The Taxonomic Rank is shown as an inverted triangle because, for any given named Species at the lowest point of the triangle, there are many that share its "higher-order" name such as a Phylum. So the area of each "layer" (or rank) represents how many lowest level Species exist at each of the higher levels. For each one Species at the tip point at the bottom, there are thousands to millions of different species at the highest rank that represents all life.
Note: Current biologists, specifically botanists, have dozens of additional classifying levels inserted into the historic 7 ranks. In fact, everyone agrees to an eighth rank at the top that is named Domain.
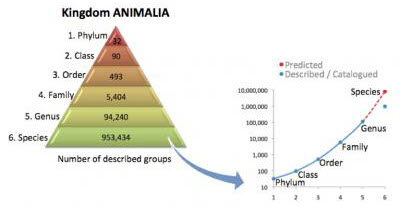
Now this inverted triangle seems a bit counter intuitive. Especially if you were to give each species a single point. And in fact, each name in each rank a point. Then there would be only a single point at the top (one domain). But millions of points at the bottom (all the species). It is this base down triangle view that leads to a tree representation to be explained next. An example of the base-down triangle indicating the number of entries per level is shown here. As given by the Center for Marine Life and excerpted in a California Academy of Science summary.
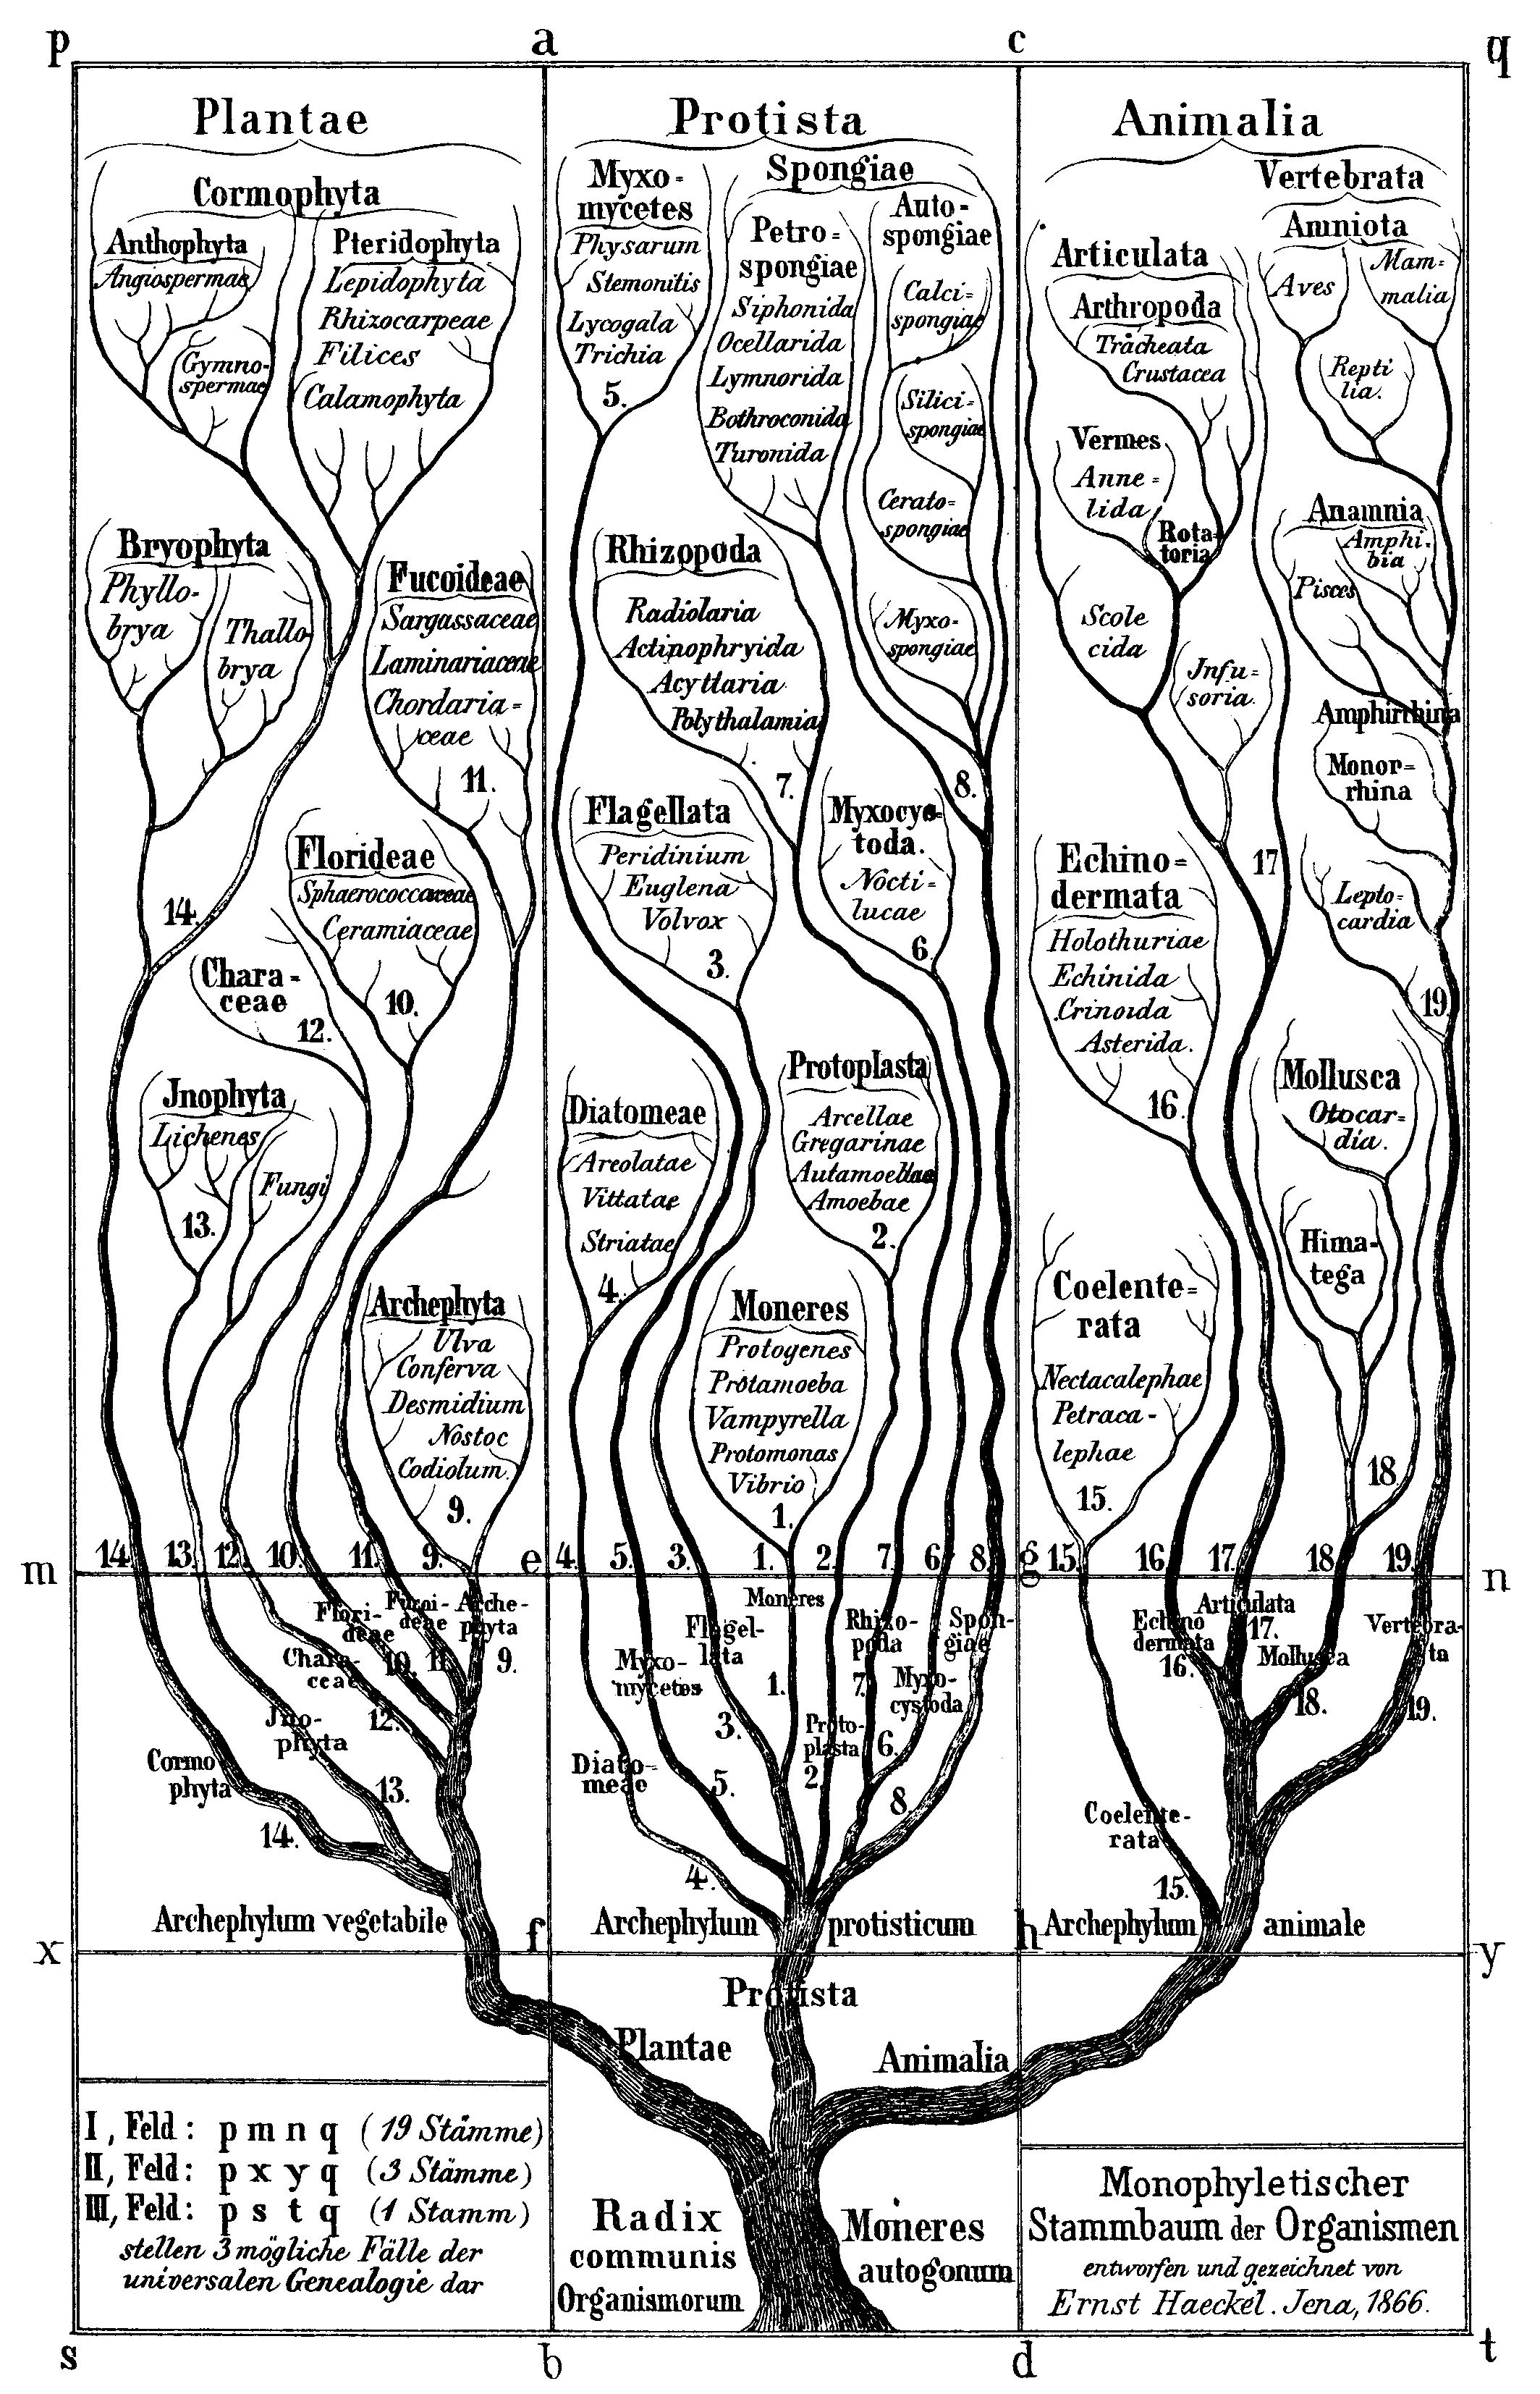
One could create a tree from the strict layering of Taxa given. Put a node or dot for every Species or lowest member of the rank on a sheet of paper across the bottom. If you want, line them all up in a row. This represents the most refined classification. Then draw a line to an added point above to represent the next level rank; say the Genus. Use a separate point for each different named Genus. This then connects all Species into their common Genus. And now connect each Genus dot with lines to a node or dot that represents the next rank up, the Family (in biological Taxa terminology). And so on. You eventually create a root Domain node at the top that represents all life. This is commonly done in biology but more often inverted with the root at the bottom. An early illustration of the Kingdom of Animals is depicted here. But remember the description. As most in aDNA have the root at the top or left side; not the bottom.
If you are an evolutionist, you would say the root is the start of life and define a time order as you traverse down from the root to the lowest-level Species leaf nodes. You have now created a Phylogenetic Tree. Some have worked to change the Taxonomic Rank triangle to such a Tree of Life (see the reference below). Note: even in the evolutionary study, it is known there is some cross-over of species along the way. So this is not a true branching tree. As we have said elsewhere, biology through time is messy. But a classification for the vast majority of activity is a help to bring some order and understanding to it.
So now lets start with the species Homo Sapiens as the root and create a similar branching tree. But instead of named branching in a taxonomic rank form, branching is formed by the introduction of a derived SNP during human evolution. The nodes with one or more SNPs are termed a haplogroup. The tree at any node can be used to form a new tree with that node as a new root. This new tree and its branching below is termed a clade. Nodes below a haplogroup are simply a lower haplogroup. But the lower nodes just below a root of a clade are each known as a sub-clade. These are terms borrowed from the phylogenetic nomenclature community and as used by the Ancient DNA community.
Another key distinction here is, like the inverted taxonomic triangle, the root of the tree is at the top (or sometimes upper left). An example of such a tree is given here.
In general, for any given haplogroup (or more specifically, the clade that includes all further down haplogroups), all members (of the clade will share the derived SNP value(s) included in that haplogroup. So, for example, if you have the derived SNP R-P312, then you are in that haplogroup and clade. Likely you can be placed in one or more of the thousands of haplogroups below R-P312 But you are known, at minimum, to be at that R-P312 node if you tested with that derived value.
Different companies and tests will cover different SNPs; some more than others. So your deepest (or most refined, or most current in time) haplogroup reported may be different as reported by different tests and companies; depends on what SNPs they tested. What is important is, for any given two or more testers, that if they are on the same path from the root to a "deepest" common haplogroupthen they share that clade. If not on that same path, you are not likely related in the near term and your common haplogroup (or ancestor) is nearer the root of humans. Two testers tested to the same level with the same test should be in the same "deep" haplogroup if they are to be related in the genealogical time frame.
A key distinction of the Taxa tree from the Phylogenetic Tree is that the haplogroup node introduced here cannot necessarily be compared to other haplogroups solely based on the number of branches down from the tree root. So our tree we introduce here is no longer a layer of Taxa. That is, unless the nodes in the tree are further classified with a timeline, one branch node that is 20 steps below the root cannot be compared to another branch node that is the same 20 steps from the root but down a different path. This is where the mathematical term "partial order" comes in. It is a branching tree but nodes in different paths are not necessarily comparable to each other. Only any common nodes they share in their path from the root can be deemed comparable. This is an important distinction to understand from the Taxonomic Rank analogy; especially in a rapidly evolving, experimental tree as described below.
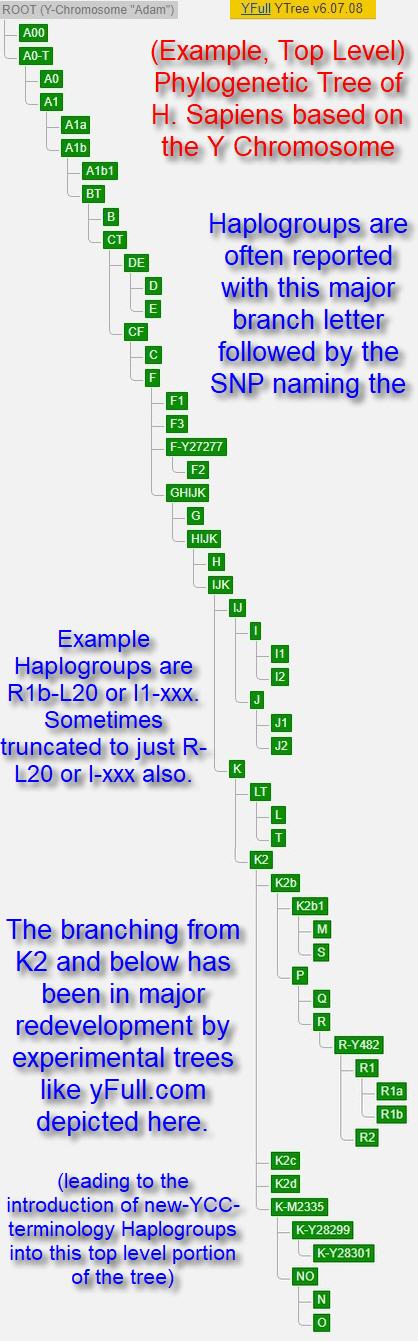
There is a separate Patriline and Matriline tree for humans that corresponds to the haplogroups defined by the yDNA chromosome and the mitochondrial DNA; respectively. As there are few SNPs in the mitochondrial DNA, the tree is much smaller and less useful for genealogy. The leaf branches in a matriline tree will generally be ancient as to when they were formed. That is, thousands of years ago. On the other hand, the yDNA phylogenetic tree has been exploding in size and complexity with the advent of next generation sequencing allowing for a deep discovery of many more SNPs. Leaf haplogroups are now being discovered that are shown to have been formed within the genealogical time frame. An example of this top level Y Phylogenetic Tree is given here.
Because of the recombining nature of the rest of the chromosomes (atxDNA), no attempt has been made to build a tree for these portions of the DNA (for genetic genealogy at least). But, in some sense, the Ad-mixture or ethnicity analysis done by microarray test companies is an effort to classify portions of the autosomes into haplogroups specific to geographic areas and populations at some point in time. This work continues to evolve with efforts to match subsets of markers down to a county level within a country or a migration path during a specific time period. This work is not formally represented as a Phylogenetic tree. Just a random scattering of defined geographic regions in history that held genetic similar populations.
The Mitochondrial PhyloTree founders (see the reference below) have a simplified, top-level Y Phylogenetic Tree. That can be useful to view the Y Phylogenetic Tree more simply. This simple top-level view used to be all there was back in the 1990's. It mimics the simple Mitochondrial PhyloTree at the top level by utilizing single letters and numbers. Early papers creating the first yDNA trees were simplistic and used the single letters. Starting in early 2000's though, the Y Phylogenetic Tree got much more complex. So much so that by the 2010's, there were tens to a hundred thousand SNPs and tens of thousands of haplogroups. When the trees got more complex then the naming evolve beyond single letters.
The nomenclature of the trees was standardized by the ad-hoc YCC group that introduced and maintained an academic, published-paper sourced Y Phylogenetic Tree from the early 1990's to mid 2000's. See the YCC page for information on the long and short format for naming the paths and haplogroup branch points in a tree. ISOGG picked up the flag to develop and maintain an academic published yDNA tree; especially when YCC ceased to exist and their website disappeared.
Today, there are several sources of the yDNA tree that are far more extant than the academic-paper based ISOGG one. This because the analysis and growth happens in real time with algorithms automatically forming the trees from the tens of thousands of consumer NGS testing results coming through. You can often, literally, watch the tree change day by day or even hour by hour as the number of testers who submit their results are processed. These newer trees are experimental and not yet agreed on by other researchers or reviewed by academics; and thus subject to change. At the same time, these experimental trees are preceding the traditional published papers by years and making new discoveries that are later shown to be correct. These changes are even forcing restructuring and branching in the once stable "single letter", top-level portion of the tree as well. Branches that are considered to have formed tens of thousands of years ago. An example top-level only portion of the Y tree is depicted here to the left.
An important distinction to make here is the terminology of a haplogroup trailed with an asterisk (*). These are special nodes representing test kits that are members of that clade or branch but no other known sub-clades or sub-branches. Either because they represent a group that never branched further or, more likely, have SNP variants that are not yet placed in the tree and thus are in a future, yet-as-undefined sub-clade branch below. A reported branch of R1b-P312 is simply the deepest haplogroup tested by that company. But R1b-P312* says you were tested for the SNPs in lower branches and are negative (ancestral) for all the known branches below. Likely, as more people are tested, the branching will be added to include others with similar SNPs and thus the reported, deepest haplogroup will change from the previous R1b-P312*. Leaf (lowest) nodes in a phylogenetic tree are not reported with an asterisk (*) as there are no defined branches below them to compare against.
Generally Phylogenetic Trees are used exclusively in population genetics and anthropology. For genetic genealogy and its matching analysis, it is generally enough to know if two tested individuals are in the same leaf haplogroup or not. But as the depth of testing is constantly being refined, the accuracy of the leaf haplogroup designation is different depending on the type and time of a test from a given company. Thus, the most expanded phylogenetic tree aids the genetic genealogy researcher in understanding if two testers could or definitely could not share the same leaf haplogroup. That is, if they were both tested to the same level by the same company at the same time, would they share a haplogroup in the current tree. Or put another way, given two results, is one on the path from the root to the other.
The term Phylogenetic Tree of Haplogroups is often shortened by genetic genealogists to the term Haplogroup tree. Or even to HaploTree by FTDNA. For this we can extend forgiveness but believe it is important to retain the phylogeny portion in the name. Hence, if we shorten at all, we shorten it to Phylogenetic Tree.
Historically, in general biology, Phylogenetics is the study of the evolutionary history of a species or population and the tree is a representation of that theory. The Evolutionary Tree is a synonym in biology and the "Tree of Life" mentioned earlier is one such representation.
STR testing generates a haplotype signature. Similar haplotype signatures can also be grouped to form a haplogroup in biological sciences. But in genetic genealogy, generally, only SNP testing results can define membership in a haplogroup. (But there are examples of placing highly stable STR values in the tree to help define a haplogroup).
An STR haplotype may predict the likely SNP-based haplogroup but usually with some limited accuracy (that is, to ancient haplogroups located earlier in the branching tree). Or so we had been led to believe by FTDNA with their very ancient haplogroup predictions. A few have developed tools to compare different STR haplotype signatures with NGS test results and thus giving deep predicted haplogroups in the tree that are usually accurate. With just the standard y67 STR markers, in many cases, they can predict the (near) leaf haplogroup discovered by Sequencing test techniques.
They have started to find very rare changing STR marker values that are very stable and can be used to define a branch point; or haplogroup, in the tree as well. Confusing our separation of terminology but something to be aware of when you view a modern tree.
Some have mistakenly taken Cladograms, generated from genetic genealogy tools that compare STR-based Haplotypes, to be a type of Phylogenetic Tree. To a degree, Cladograms are Phylogenetic trees in that they are trying to order STR changes in time. But cladograms, as generated by genetic genealogy tools, use haplotypes based on STR values as the branch points and not haplogroups.
In traditional biology, the directed tree is represented by nodes and branches (vertices and edges in graph theory). A node only has a single entry point (branch above) but multiple exit points. The haplogroup is labeled on the branch above. Nodes represent the MRCA that shared that labeled branch above. The seminal 2002 YCC paper that defined how we name haplogroups followed this method.
For convenience, all modern trees push the label to the single node below a branch. So a node becomes a haplogroup block. Then all branches are singular between haplogroups and with no specific meaning for a branch other than defining the connection. So an MRCA node and its single haplogroup named branch above become one in the same. Testers can then be defined attached to any haplogroup (node or block).
In this tree method, there will always be leaf haplogroups but no leaf branches. The root is a haplogroup distinguishing homosapiens from other humanoids. In traditional trees, the root and leafs are branches and not nodes.
Before explaining this further, lets first re-introduce the Taxonomic Rank from your school days to help understand this further.
Taxonomic Rank
Taxonomic Rank
The Taxonomic Rank is shown as an inverted triangle because, for any given named Species at the lowest point of the triangle, there are many that share its "higher-order" name such as a Phylum. So the area of each "layer" (or rank) represents how many lowest level Species exist at each of the higher levels. For each one Species at the tip point at the bottom, there are thousands to millions of different species at the highest rank that represents all life.
Note: Current biologists, specifically botanists, have dozens of additional classifying levels inserted into the historic 7 ranks. In fact, everyone agrees to an eighth rank at the top that is named Domain.
Inverted Taxonomic Rank

Tree Representation of Taxonomy
If you are an evolutionist, you would say the root is the start of life and define a time order as you traverse down from the root to the lowest-level Species leaf nodes. You have now created a Phylogenetic Tree. Some have worked to change the Taxonomic Rank triangle to such a Tree of Life (see the reference below). Note: even in the evolutionary study, it is known there is some cross-over of species along the way. So this is not a true branching tree. As we have said elsewhere, biology through time is messy. But a classification for the vast majority of activity is a help to bring some order and understanding to it.
Phylogenetic Tree of Humans
Phylogenetic Tree of H. Sapiens (yDNA)
So now lets start with the species Homo Sapiens as the root and create a similar branching tree. But instead of named branching in a taxonomic rank form, branching is formed by the introduction of a derived SNP during human evolution. The nodes with one or more SNPs are termed a haplogroup. The tree at any node can be used to form a new tree with that node as a new root. This new tree and its branching below is termed a clade. Nodes below a haplogroup are simply a lower haplogroup. But the lower nodes just below a root of a clade are each known as a sub-clade. These are terms borrowed from the phylogenetic nomenclature community and as used by the Ancient DNA community.
Another key distinction here is, like the inverted taxonomic triangle, the root of the tree is at the top (or sometimes upper left). An example of such a tree is given here.
In general, for any given haplogroup (or more specifically, the clade that includes all further down haplogroups), all members (of the clade will share the derived SNP value(s) included in that haplogroup. So, for example, if you have the derived SNP R-P312, then you are in that haplogroup and clade. Likely you can be placed in one or more of the thousands of haplogroups below R-P312 But you are known, at minimum, to be at that R-P312 node if you tested with that derived value.
Different companies and tests will cover different SNPs; some more than others. So your deepest (or most refined, or most current in time) haplogroup reported may be different as reported by different tests and companies; depends on what SNPs they tested. What is important is, for any given two or more testers, that if they are on the same path from the root to a "deepest" common haplogroupthen they share that clade. If not on that same path, you are not likely related in the near term and your common haplogroup (or ancestor) is nearer the root of humans. Two testers tested to the same level with the same test should be in the same "deep" haplogroup if they are to be related in the genealogical time frame.
A key distinction of the Taxa tree from the Phylogenetic Tree is that the haplogroup node introduced here cannot necessarily be compared to other haplogroups solely based on the number of branches down from the tree root. So our tree we introduce here is no longer a layer of Taxa. That is, unless the nodes in the tree are further classified with a timeline, one branch node that is 20 steps below the root cannot be compared to another branch node that is the same 20 steps from the root but down a different path. This is where the mathematical term "partial order" comes in. It is a branching tree but nodes in different paths are not necessarily comparable to each other. Only any common nodes they share in their path from the root can be deemed comparable. This is an important distinction to understand from the Taxonomic Rank analogy; especially in a rapidly evolving, experimental tree as described below.
There is a separate Patriline and Matriline tree for humans that corresponds to the haplogroups defined by the yDNA chromosome and the mitochondrial DNA; respectively. As there are few SNPs in the mitochondrial DNA, the tree is much smaller and less useful for genealogy. The leaf branches in a matriline tree will generally be ancient as to when they were formed. That is, thousands of years ago. On the other hand, the yDNA phylogenetic tree has been exploding in size and complexity with the advent of next generation sequencing allowing for a deep discovery of many more SNPs. Leaf haplogroups are now being discovered that are shown to have been formed within the genealogical time frame. An example of this top level Y Phylogenetic Tree is given here.
Because of the recombining nature of the rest of the chromosomes (atxDNA), no attempt has been made to build a tree for these portions of the DNA (for genetic genealogy at least). But, in some sense, the Ad-mixture or ethnicity analysis done by microarray test companies is an effort to classify portions of the autosomes into haplogroups specific to geographic areas and populations at some point in time. This work continues to evolve with efforts to match subsets of markers down to a county level within a country or a migration path during a specific time period. This work is not formally represented as a Phylogenetic tree. Just a random scattering of defined geographic regions in history that held genetic similar populations.
The Mitochondrial PhyloTree founders (see the reference below) have a simplified, top-level Y Phylogenetic Tree. That can be useful to view the Y Phylogenetic Tree more simply. This simple top-level view used to be all there was back in the 1990's. It mimics the simple Mitochondrial PhyloTree at the top level by utilizing single letters and numbers. Early papers creating the first yDNA trees were simplistic and used the single letters. Starting in early 2000's though, the Y Phylogenetic Tree got much more complex. So much so that by the 2010's, there were tens to a hundred thousand SNPs and tens of thousands of haplogroups. When the trees got more complex then the naming evolve beyond single letters.
The nomenclature of the trees was standardized by the ad-hoc YCC group that introduced and maintained an academic, published-paper sourced Y Phylogenetic Tree from the early 1990's to mid 2000's. See the YCC page for information on the long and short format for naming the paths and haplogroup branch points in a tree. ISOGG picked up the flag to develop and maintain an academic published yDNA tree; especially when YCC ceased to exist and their website disappeared.
Today, there are several sources of the yDNA tree that are far more extant than the academic-paper based ISOGG one. This because the analysis and growth happens in real time with algorithms automatically forming the trees from the tens of thousands of consumer NGS testing results coming through. You can often, literally, watch the tree change day by day or even hour by hour as the number of testers who submit their results are processed. These newer trees are experimental and not yet agreed on by other researchers or reviewed by academics; and thus subject to change. At the same time, these experimental trees are preceding the traditional published papers by years and making new discoveries that are later shown to be correct. These changes are even forcing restructuring and branching in the once stable "single letter", top-level portion of the tree as well. Branches that are considered to have formed tens of thousands of years ago. An example top-level only portion of the Y tree is depicted here to the left.
An important distinction to make here is the terminology of a haplogroup trailed with an asterisk (*). These are special nodes representing test kits that are members of that clade or branch but no other known sub-clades or sub-branches. Either because they represent a group that never branched further or, more likely, have SNP variants that are not yet placed in the tree and thus are in a future, yet-as-undefined sub-clade branch below. A reported branch of R1b-P312 is simply the deepest haplogroup tested by that company. But R1b-P312* says you were tested for the SNPs in lower branches and are negative (ancestral) for all the known branches below. Likely, as more people are tested, the branching will be added to include others with similar SNPs and thus the reported, deepest haplogroup will change from the previous R1b-P312*. Leaf (lowest) nodes in a phylogenetic tree are not reported with an asterisk (*) as there are no defined branches below them to compare against.
Generally Phylogenetic Trees are used exclusively in population genetics and anthropology. For genetic genealogy and its matching analysis, it is generally enough to know if two tested individuals are in the same leaf haplogroup or not. But as the depth of testing is constantly being refined, the accuracy of the leaf haplogroup designation is different depending on the type and time of a test from a given company. Thus, the most expanded phylogenetic tree aids the genetic genealogy researcher in understanding if two testers could or definitely could not share the same leaf haplogroup. That is, if they were both tested to the same level by the same company at the same time, would they share a haplogroup in the current tree. Or put another way, given two results, is one on the path from the root to the other.
The term Phylogenetic Tree of Haplogroups is often shortened by genetic genealogists to the term Haplogroup tree. Or even to HaploTree by FTDNA. For this we can extend forgiveness but believe it is important to retain the phylogeny portion in the name. Hence, if we shorten at all, we shorten it to Phylogenetic Tree.
Historically, in general biology, Phylogenetics is the study of the evolutionary history of a species or population and the tree is a representation of that theory. The Evolutionary Tree is a synonym in biology and the "Tree of Life" mentioned earlier is one such representation.
STR testing generates a haplotype signature. Similar haplotype signatures can also be grouped to form a haplogroup in biological sciences. But in genetic genealogy, generally, only SNP testing results can define membership in a haplogroup. (But there are examples of placing highly stable STR values in the tree to help define a haplogroup).
An STR haplotype may predict the likely SNP-based haplogroup but usually with some limited accuracy (that is, to ancient haplogroups located earlier in the branching tree). Or so we had been led to believe by FTDNA with their very ancient haplogroup predictions. A few have developed tools to compare different STR haplotype signatures with NGS test results and thus giving deep predicted haplogroups in the tree that are usually accurate. With just the standard y67 STR markers, in many cases, they can predict the (near) leaf haplogroup discovered by Sequencing test techniques.
They have started to find very rare changing STR marker values that are very stable and can be used to define a branch point; or haplogroup, in the tree as well. Confusing our separation of terminology but something to be aware of when you view a modern tree.
Some have mistakenly taken Cladograms, generated from genetic genealogy tools that compare STR-based Haplotypes, to be a type of Phylogenetic Tree. To a degree, Cladograms are Phylogenetic trees in that they are trying to order STR changes in time. But cladograms, as generated by genetic genealogy tools, use haplotypes based on STR values as the branch points and not haplogroups.
In traditional biology, the directed tree is represented by nodes and branches (vertices and edges in graph theory). A node only has a single entry point (branch above) but multiple exit points. The haplogroup is labeled on the branch above. Nodes represent the MRCA that shared that labeled branch above. The seminal 2002 YCC paper that defined how we name haplogroups followed this method.
For convenience, all modern trees push the label to the single node below a branch. So a node becomes a haplogroup block. Then all branches are singular between haplogroups and with no specific meaning for a branch other than defining the connection. So an MRCA node and its single haplogroup named branch above become one in the same. Testers can then be defined attached to any haplogroup (node or block).
In this tree method, there will always be leaf haplogroups but no leaf branches. The root is a haplogroup distinguishing homosapiens from other humanoids. In traditional trees, the root and leafs are branches and not nodes.
External Links
- The YCC Consortium, A Nomenclature System for the Tree of Human Y-Chromosomal Binary Haplogroups, Genome Res. 2002. 12: 339-348 (the seminal paper on a standardized naming for Y haplogroup trees)
- UC Berkeley Evolutionary Trees Introduction
- PhyloTree.org: Mitochondrial DNA-based Phylotree of Haplogroups; they also introduced the first top-level, simplified Y Haplogroup Phylotree
- ISOGG Tree: Y chromosome based Phylotree of Haplogroups; based on the original YCC work from the University of Arizona
- yFull.com Tree: a recent newcomer to the field of Y Haplogroup Phylogenetic tree, built solely from Sequencing testing. (see also yfull).
- yTree.net: a partial Y Haplogroup Phylogenetic tree that starts with Haplogroup R1b-P312 as the root. The nicest presentation form for a phylogenetic tree to date. (see also ytree).
- FTDNA's Y-Tree: (historic, archive) from 2015 just before BigY introduced. Is now behind their member login.
- Phylogenetic Tree defined on Wikipedia
- Taxonomic Rank on Wikipedia
- Tree of Life (on the web) project
- Phylogenetic Tree defined on Khan Academy
- CeCe Moore Blog Post with tree development timeline